Liquidity as measured by bids for repo, reverse repo, MSF and MSS bonds outstanding has surged over the last two weeks. Liquidity was in surplus of Rs 6.7 trillion as of 23rd December and has since increased to Rs 8.2 trillion as of 4th January 2017. Is the surge of Rs 1.5 trillion in liquidity due to the sharp inflow of demonetised notes into the banking system in the week from 23rd December to 30th December?
It is not easy to pinpoint the source of liquidity but we can look at data available and try tally it with the system liquidity.
In the period 11th November to 23rd December, currency in circulation fell by Rs 8.2 trillion. Bank deposits in the same period rose by Rs 4.2 trillion as per RBI data. Banks had issued Rs 6 trillion of new notes into the system as of 20th December.
Adding fall in currency in circulation and issue of fresh notes to public, the total inflow from demonetised notes as of 23rd December is Rs 14.2 trillion. However given that as of 23rd December, system liquidity was in surplus of Rs 6.7 trillion while bank deposits only grew by Rs 4.2 trillion, there is gap of Rs 2.5 trillion, which shows that deposit figures as of 23rd December is not the right estimate.
The surplus of Rs 8.2 trillion in the system is largely due to high deposits with the banking system. However, given that RBI has been replacing old currency with new currency, outflows from the banks would be well above Rs 6 trillion (the last published figure by RBI).
Bank deposits could also have increased by deposits of new notes.
RBI has issued a clarification on demonetised numbers saying that it is still reconciling accounts and will soon publish the numbers. Until then it is guesswork but the surge in liquidity, bank deposit growth and fall in currency in circulation are still not adding up.
Conspiracy Theory Refuted by Data
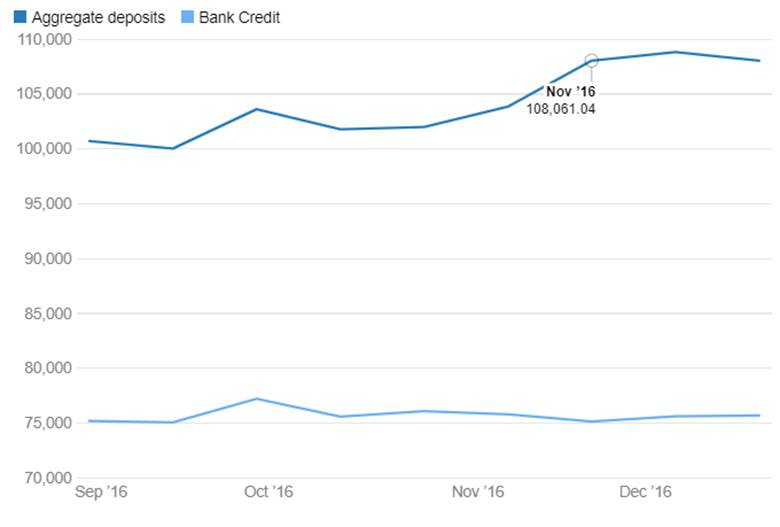
Demonetisation opponents and conspiracy theorists are trying to imply that a surge in bank deposits in the August to September 2016 period indicates that the move was leaked to a few who took advantage of the information to convert black money to white by depositing the money in banks. Bank deposits rose by Rs 3.83 trillion in the period from 5th August to 30th September with deposits touching all time highs of Rs 100.01 trillion on 30th September. Chart 1
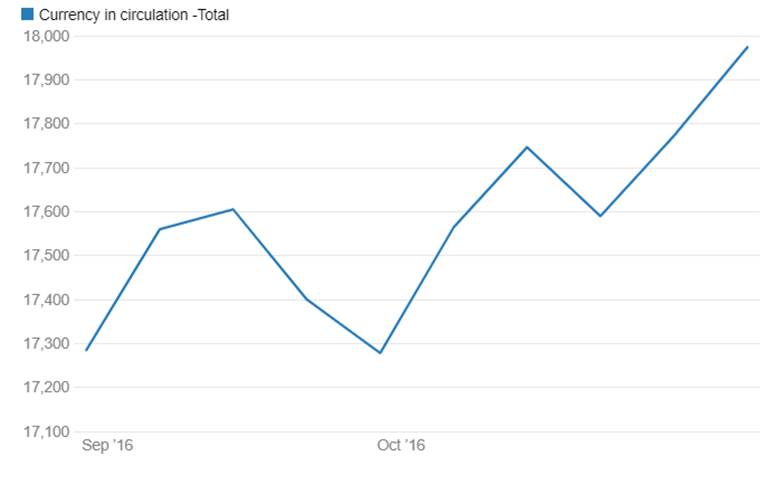
How does the banking system get deposits? Demonetisation has shown that when people deposit cash into accounts, deposits grow and in the 8th November to 18th November period, people deposited Rs 5.4 trillion of cash into bank accounts. This figure will reflect a fall in currency in circulation to that extent.
In the August to September period, currency in circulation grew by Rs 500 billion, and the deposits certainly did not come from black money being converted into white. Chart 3
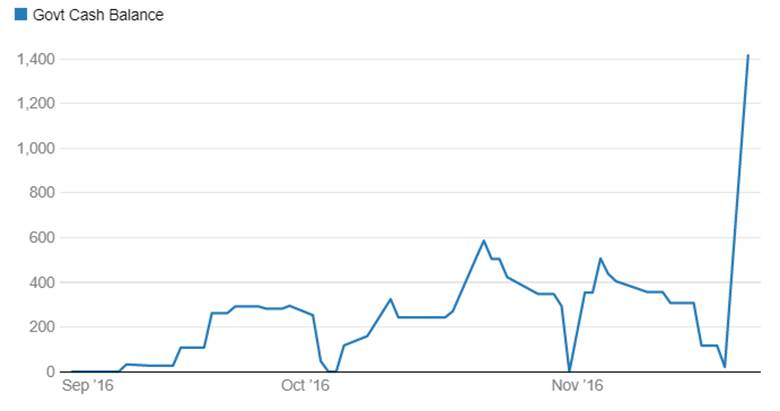
In August, the government cash balances fell sharply despite receiving a dividend of Rs 658 billion from RBI. The government released 7th pay commission arrears to its employees for around Rs 450 billion and was also spending heavily. The government was in fact drawing overdraft from RBI WMA (Ways and Means Advances) of Rs 450 billion to spend. Government spending goes straight into the banking system. Chart 2
Banks when they give credit, creates more deposits, which is the money multiplier factor. Banks have also shown growth in lending in the August-September 2016 period, and this leads to creation of deposits. Chart 1
Corporate India parks surplus cash with mutual funds as am alternative to bank deposits. Mutual funds typically see large scale shift from their liquid funds to bank deposits as banks offer higher rates to corporates to shore up deposit base for the half year end in September. This shift too has accounted for the rise in bank deposits.
All Scheduled Banks Deposits and Credit (Rs billlion)
Govt Cash Balances with RBI (In Rs billion)
Currency in circulation -Total (Rs billion)