
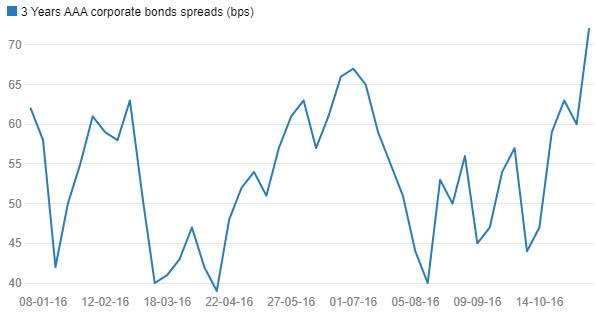
As on 14th November 2016, 3 years AAA corporate bond spreads were at 72 bps, highest levels seen since January 2016.These short-term spreads rose since early October to levels of 72 bps, as short term corporate bond yields were range bound but short term G-sec yields fell sharply. Demonetisation of Rs 500 and Rs 1000 notes can lead to surge of Liquidity Short term credit spreads are likely to go down on expectations of rate cut and surge in system liquidity.
3 Years AAA corporate bonds spreads (bps)
FII debt utilisation status stood at 74.33% of total limits. Commercial Paper (CP) market trading volumes were 92.65% higher against previous week and Certificate of Deposits (CD) volumes were 50.79% higher week on week.
Corporate Bonds Traded Levels
Three-year AAA corporate bonds were trading at levels of 7.23% as of week ended 11th November. Spreads were 12 bps up week on week at 72 bps. Three-year AAA NBFC bonds were trading at levels of 7.78% with spreads 12 bps up at 127 bps levels. Three year AA+ NBFC bonds were trading at levels of 8.05% with spreads 2 bps up at 154 bps.
Five-year AAA corporate bonds were trading at levels of 7.26%. Spreads were 3 bps up at 58 bps. Five-year AAA NBFC bonds were trading at levels of 7.83% with spreads 12 bps up at 115 bps.
Ten-year AAA corporate bonds were trading at levels of 7.43% with spreads 3 bps down at 60 bps. Ten-year AAA NBFC bonds were trading at levels of 7.78% with spreads 2 bps down at 95 bps.
In the week ended 11th November, FIIs were net buyer of INR bonds for around Rs 39.85 billion for the week. Reported corporate bond traded volumes stood at Rs 217.82 billion with daily average volumes of Rs 43.56 billion. Volumes were 35.95% higher compared to the previous week.
CP traded volumes were at Rs 385.59 billion (92.85% higher than previous week) with daily average volumes of Rs 77.11 billion. CD volumes were at Rs 156.29 billion (50.79% higher than previous week) with daily average volumes of Rs 31.25 billion.
One month PSU bank CDs were trading at 6.35% levels. Three-month residual maturity CDs were most active with volumes of Rs 49.65 billion. Three months and twelve months PSU bank CDs were trading at 6.43% and 6.75% levels each at spreads of 18 bps and 45 bps respectively against T-bill yields. Three months maturity Manufacturing and NBFC sector CPs were trading at 6.50% and 6.80% levels respectively.
One-year maturity Manufacturing and NBFC sector CPs were trading at 7.40% and 7.60% levels respectively.
As on 11th November debt utilisation status stood at 74.33% of total limit, 85 bps higher against previous week. FPI debt limit in government securities increased to Rs 4718 billion from Rs 4583 in October 2016. FIIs have invested total of Rs 3506.85 billion in INR debt. FII investment position stands at Rs 1806.8 billion in gilt securities that also includes investment in Interest Rate Futures and at Rs 16700.05 billion in corporate bonds
