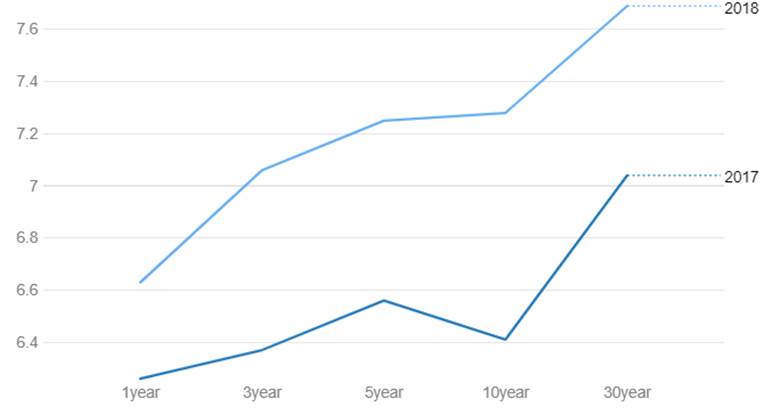
In markets, there is a famous saying that If you invest in equities, you should keep an eye on the bond market. If you invest in real estate, you should keep an eye on the bond market. If you invest in bonds, you should definitely keep an eye on the bond market. If we look at the current bond yield curve, which is now steep, it suggests that theequity rally still has a long way to go. (Chart1). The yield curve has steepen due to various reason such as 1. RBI policy, 2. Inflation, 3. Bond Oversupply, 4. Concern on Fiscal Slippages 5. Fed Rate Hikes But most importantly, the steepening yield curve suggests higher inflation and improvement in economic condition going forward, which is the most important factor for the equity market bull run.
India Yield Curve (During January)
There are series of economic data which are increasing like inflation, export data, iip number, fiscal deficit they all are positive for equity market. However, inflation and fiscal deficit is not good for bond market.
Fiscal Deficit- Post demonetization, private expenditure came off sharply and demand was subdued in the economy leading to a slowdown in the economy. In order to boost economic growth, government started spending on roads and infrastructure placing a strain on its finances. The government is borrowing an additional Rs 500 Billion in this fiscal year after revenue collection from GST fell to its lowest levels in October since July. The market also expects Budget 2018-19 to be populist and rural sectors focussed given that the Gujarat election results were negative for BJP in rural areas. Budget may look at a fiscal push to rural growth leading to both higher borrowings and higher inflation on the back of consumption demand. which augurs well for an equity markets as rural demand will increase and companies in FMCG, Agri commodity space can see uptick in their earnings.
Bank Recap & Bharatmala Road Projects- The Cabinet gave the go-ahead to highway projects worth about Rs 7 trillion for development of over 80,000 km of highways including Bharatmala project in the next five years. Bharatmala is a mega plan of the government and the second-largest highways project after NHDP that saw the development of about 50,000 km and aims at improving connectivity in border and other areas. The Centre also announced Rs 2.11 trillion recapitalization plan for public sector banks spread over two years in a bid to shore up their finances, boost private investment and revive the economy. Due to NPA issues banks are not showing keen interest to lend money to infrastructure companies, Bank recapitalization would help infrastructure companies to borrow money from banks to execute projects. Implementation of ‘Bharatmala Pariyojan scheme’ would mean that companies in the public-private partnership space would receive more orders from the Government. Companies that build roads and highways would be big beneficiaries as increase in their order book would eventually translate into higher revenues and profitability for them.
Economic Condition- Last year Indian economy saw two major reforms Demonetization and GST, due to which the Indian economy went into deceleration mode but recent GDP forecast by World bank suggest India economy is back on track. India GDP growth is expected to rise by 7.3% in 2018-19, making India again the world’s fastest-growing economy. Recent IIP data suggests improvement in manufacturing sector, IIP growth for November 2017 printed at 8.4%, highest level since October 2015. Manufacturing index recorded a growth of 10.2%. Going forward industrial production is expected to do well as industry has come out from the shock of demonetisation, improvement in consumer demand and government is working hard to end GST glitches.
Trade Data- Exports have started to show a positive trend since September 2016 (except October 2017 data), which indicates improvement in global trade conditions. However, trade deficit was at USD 114 billion in the April-December period from levels of USD 78.43 billion last year as imports jumped 21.76% while exports rose at a slower pace of 12.05%. Exports were lower due to the implementation of GST as exporters had to first pay IGST and seek refunds after the goods were exported. Apart from that technology glitches while filing GST led to delay in tax refunds.
Inflation- December 2017 CPI inflation came in at 5.21%, highest level since July 2016. Core inflation was at levels of 5%. Rising fuel prices and higher prices of vegetables and fruits led to CPI printing higher. Going forward, base effect and high oil prices will keep inflation at higher levels. Demand-led inflation is still low given an output gap that has persisted for a long while due to lack of investments. However, with growth picking up, exports picking p and global economy showing strong recovery signs, demand is expected to pick up leading to higher inflation expectations.
Fed Rate Hike- The Fed hiked rates from record lows of zero percent maintained since December 2008 for the first time in December 2015 and followed up with another 75 bps hike in 2017. The Fed has guided for further 3 more rate hikes in 2018. Fed rate hikes indicate strength in the US economy, US Real GDP clocked in at a 3.3% annualized rate in Q3 2017, up from the second-quarter 3.1% growth, marking the largest quarterly gain in three years. Improvement in US economy can lead to higher global growth.
Automobiles Number (SIAM data)- Automobile production has also increased in last one year, the industry produced a total 21,415,719 vehicles including Passenger Vehicles, Commercial Vehicles, Three Wheelers, Two Wheelers and Quadricycle in April-December 2017 as against 19,247,352 in April-December 2016, registering a growth of 11.27 percent over the same period last year.
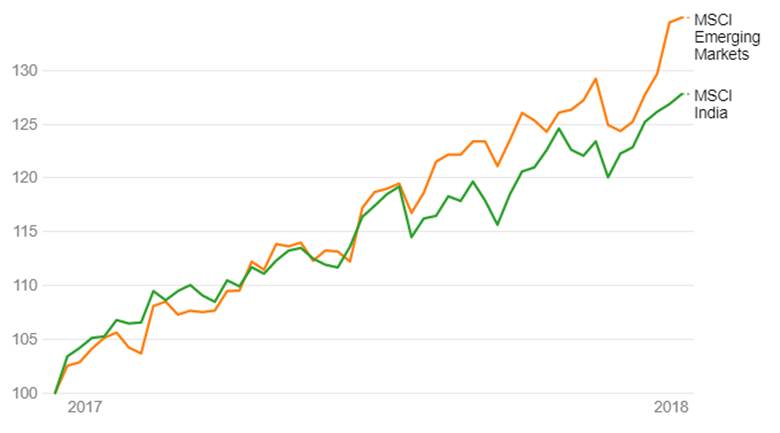
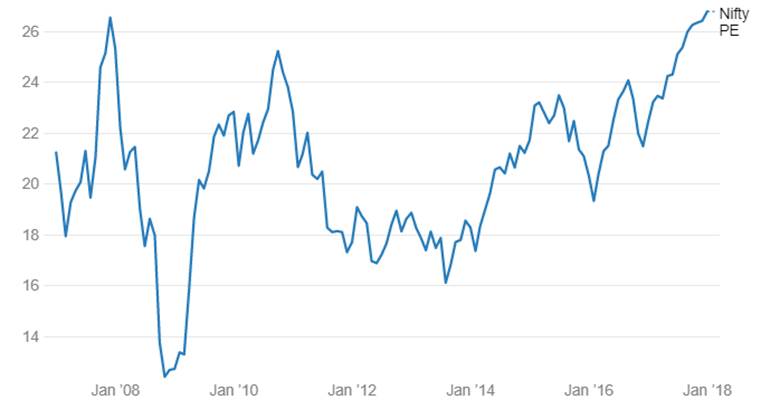
Indian equity market is in dream bull run, Nifty YTD return is around 28% and currently nifty trades at a PE multiple of 26.79, which is around it highest level in a decade (Chart 2). The Indian markets may be reaching new highs every other day, but it has been underperforming the MSCI Emerging Market index in recent months (Chart3). Despite the underperformance of MSCI India index against the MSCI EM index, the Indian market continues to be relatively pricey. Many market participants are worried about high nifty PE but if we look at the steepening bond yield curve, it suggests good times are still ahead for indian equity markets.
Nifty PE Ratio
MSCI Emerging Market Vs MSCI India