
The unprecedented record low interest rates globally will come to an end in 2017. The Fed has raised rates twice by 25bps each in December 2015 and 2016 and is likely to raise rates by 75 bps to 100 bps in 2017. ECB will end QE in 2017 and guide for higher rates in 2018. Prospects of economic growth and inflation are looking brighter with US leading the way. US equity indices are at record highs while European indices too are trending to record highs. Commodity prices have rebounded from lows in 2016 and outlook for select industrial commodities is positive.
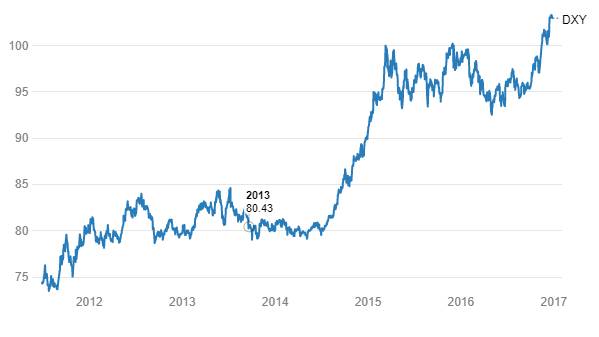
US treasury yields are climbing and have backed up by 100bps from lows seen in 2016. Yields in Germany have risen from negative levels. The USD is strong and trading at close to record highs. Emerging currencies have lost ground against the USD including the INR.
India in the backdrop of rising interest rates globally, albeit from record low, will be hard pressed to buck the trend though rates may not rise by much. RBI will keep the Repo Rate stable at 6.25%, keep liquidity easy and comfortable while the government spends to push up economic growth even as it keeps down fiscal deficit. Government will have a one time fiscal boost on demonetisation and higher economic growth will lead to higher taxes and that will help keep down fiscal deficit. Introduction of the path breaking indirect tax reform, GST, will also be highly positive for the government’s fiscal position.
India inflation is unlikely to go down to 4% levels but will stay within the RBI 4% +/- 2% target range. Stable oil prices, improved supply as stalled projects take off will keep down inflation expectations. Demonetisation will keep down growth and inflation in the 3rd and 4th quarter of fiscal 2016-17 but the effect will wear off in fiscal 2017-18 as latent demand comes back into the economy.
Steady repo rate, stable inflation, comfortable liquidity and manageable macros will keep yields steady while rising global bond yields will push the yield curve by around 25bps to 50bps from current levels. The yield curve will be steep and steady.
Corporate bonds too will see a marginal rise in yields though spreads will stay down on good liquidity and improved corporate health. Economic growth can lower spreads at the lower end of the credit rating scale.
Ideal fixed income portfolio in 2017 will be 50% in AAA rated corporate bonds of maturities of five years, 50% in lower rated corporate bonds of maturities of 3 years to 5 years. Less risk averse investors can increase weight in AAA bonds and lower weight in lower rated bonds.
In terms of fixed income funds, 50% in short term income funds and 50% in credit funds. Less risk averse investors can invest 25% in ultra short funds, 50% in short term income funds and 25% in credit funds.
Tax free bonds is avoidable as tax rates could come off in the budget and outlook for yields at the long end of the curve is not positive.
Risk to Fixed Income Investment Strategy 2017
The primary risk for interest rates is sharper than expected inflation in the US leading to faster pace of Fed rate hikes, which can lead to capital outflows. Credit spreads could be affected if economic growth is weak and that will lead to rise in yields on lower rated corporate bonds.
Risk of demand and supply mismatch in government bonds exist. Banks, the largest holders of government bonds are holding bonds well in excess of statutory requirement and if they do not participate in government bond auctions and sell governments bonds if credit offtake improves, yields could trend up faster than expected.
Introduction
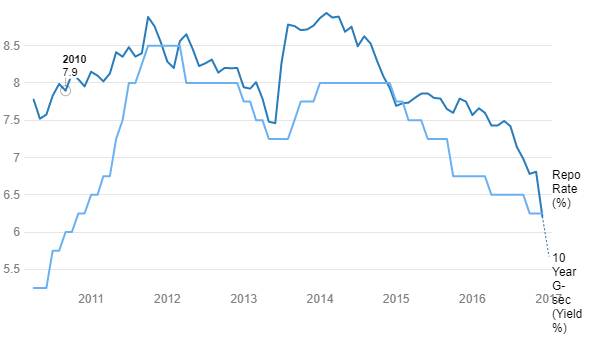
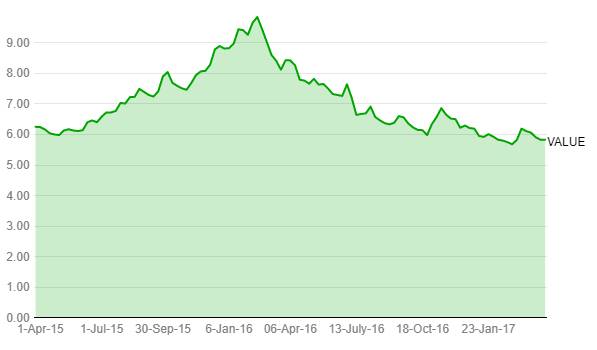
The ten year government bond to repo rate spread which had widened considerably in 2015, fell sharply to go negative in November 2016 post demonetisation and RBI rate cut expectations. The spread widened against in December 2016 as RBI left rates status quo, which may have been the last chance for the RBI to lower rates. The government bond and repo rate spread is likely to widen further and stay wide as markets factor in no rate cuts in 2017.
10 Years G-sec Vs Repo Rate
What is the outlook for the bond market in 2017 and what should be the fixed income strategy for this year? We answer these two questions in this Fixed Income Investment Strategy Report for 2017.
What is the outlook and strategy for the bond market in 2017?
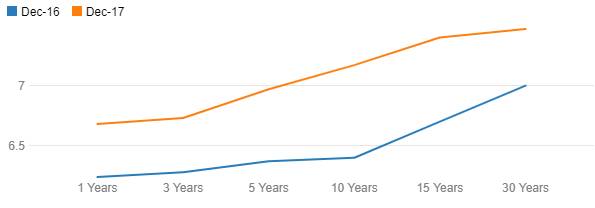
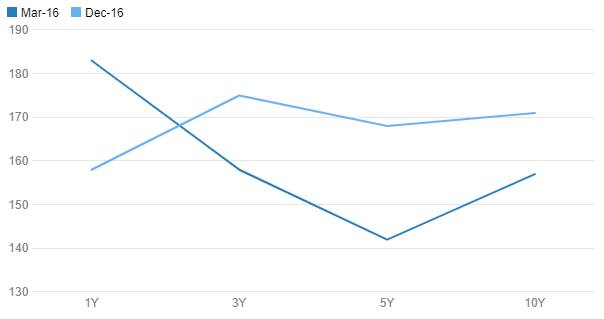
The year 2016 saw the government bond yield curve falling Chart 2 & Chart 3 as RBI lowered the repo rate by 50bps from 6.75% to 6.25% and demonetisation added to the flavour of government bonds in the short term as banks bought into the market on the back of excess liquidity. However, bond yields backed up from lows as demonetisation euphoria left. Bond market will factor in no rate hikes in 2017 on the back of the following factors.
1. RBI CPI inflation target for 2017 – RBI has kept a CPI medium term inflation target at 4% but for 2017, it will maintain a target of 5%, which is the level it had kept for 2016. RBI will consider better prospects for US and global economic growth and higher domestic economic growth when it sets the target. Implicit real rate of interest is around 1.25% as stated by the RBI governor, Dr. Urjit Patel and repo rate of 6.25% maintains that real rate at inflation of 5%.
2.Fed Rate Hikes – The Fed hiked rates from record lows of zero percent maintained since December 2008 for the first time in December 2015 and followed up with another 25bps hike in December 2016. The Fed has guided for further 75bps to 100bps rate hikes in 2017. Fed rate hikes indicate strength of the US economy and if there is divergence between relative economic strength of India and US, capital outflows could be high. RBI will not want to risk outflows and would be hesitant to cut the repo rate unless there are positive factors that could bring in capital inflows into the economy.
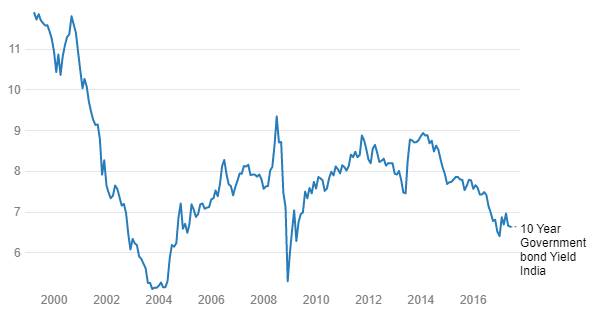
10 Year Government bond Yield India
India Yield Curve (G-sec)
Inflation, Fiscal Deficit,CAD and Global Macro
Inflation Expectations
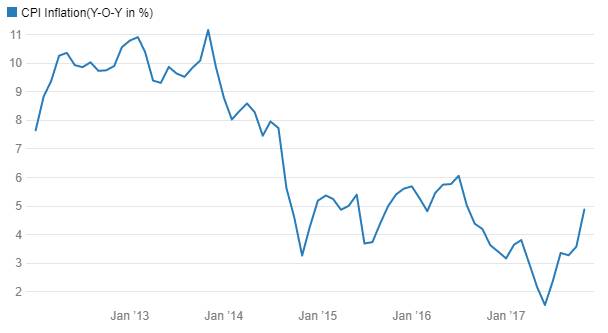
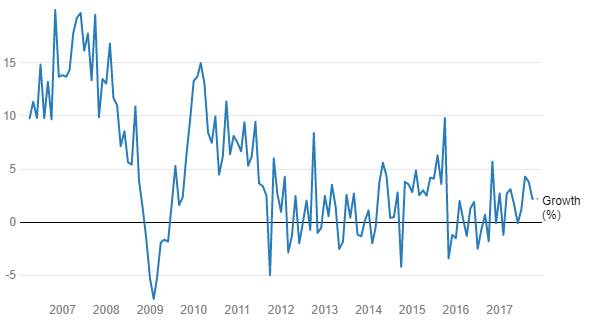
CPI inflation for November 2016 printed at 3.63% against 4.20% levels seen in October 2016 and 5.41% levels seen in November 2015. Chart 4 Food inflation was 2.11% against 6.07%. Core inflation held steady at around 4.75% to 5% levels over the year. RBI has forecast inflation at 5% levels as of March 2017, which could come in lower due to demonetisation effects. RBI’s medium term CPI target is 4% but given that the government will spend for growth in its 2017-18 budget and that global economies are expected to do better, which could take up select commodity prices, inflation target for 2018 would be around 5% levels. Food inflation outlook is not very negative as La Nina effect is expected to persist in 2017.
India’s index of industrial production rose by -0.3% in the April-October 2015 period against 4.8% seen last year and this negative growth from a low base does not indicate strong demand revival in the economy. Demonetisation would add to the degrowth in IIP for this fiscal year. Chart 5
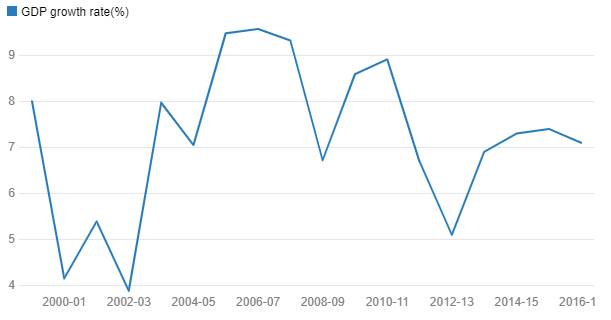
India’s economy is expected to grow at levels of around 7% in this fiscal year with growth being brought down from initial forecast levels of around 7.6% on effects of demonetisaton. Chart 6 Economic growth would revive in 2017-18 on government spending and improved global economic growth. Exports have started to show a positive trend since September 2016 indication improved global trade conditions.
CPI Inflation(Y-O-Y in %)
Index Of Industrial Production
India GDP growth
Fiscal Deficit and Demand Supply of Government Bonds
The government is targeting a fiscal deficit of 3% of GDP for the fiscal years 2017-18 and 2018-19. The fiscal deficit target of 3.5% of GDP for this fiscal year is likely to be met given that tax collections are on target with growth of 21.2% in the April-November 2016 period. Direct taxes grew by 15% and indirect taxes grew by 26.2%. The government will also receive an one time fiscal boost on demonetisation and one time disclosure schemes, the boost could total as much as Rs 3000 billion.
The government is likely to achieve its 2017-18 fiscal deficit target of 3% of GDP, as taxes would rise on higher economic growth and on the back of introduction of GST. Government borrowing too is unlikely to increase by much in the coming years on account of lower deficits.
It is imperative that the government sticks to its commitment of fiscal deficit of 3% of GDP for fiscal 2017-18 if it wants interest rates to stay stable in the economy. The reason is that banks have upped their investments in government bonds post demonetisation. Investments have grown by 21% as of December 2016, year on year, against growth of just 6% seen last year. Banks are already well above the SLR rate of 20.50% (as of March 2017) at levels of 28%. Demand from banks for government bonds will be low next fiscal year.
Current Account Deficit, INR
CAD is financed by capital flows that have been adequate so far. Capital flows are expected to be much higher than the CAD over the next two years leading to positive BOP (Balance of Payment) position that will lead to accretion of fx reserves and improved external fundamentals.
The INR is now an important factor in determining the level of interest rates in the economy given the amount of debt portfolio flows into the economy. INR can sustain its levels if the CAD is manageable and BOP position is positive and this would enable interest rates in the economy to trend down on improved liquidity position as the RBI purchases USD. Bond yields would trend down given improved liquidity situation.
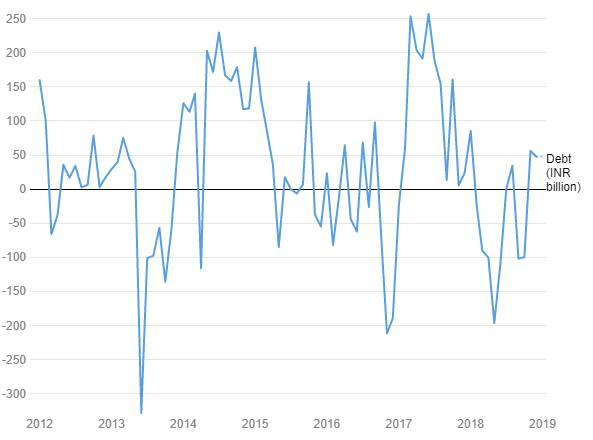
Portfolio flows were negative by USD 5.02 billion for debt in the April-December 2016 period while equity saw inflows of USD 5.12 billion. Portfolio flows are just about positive this fiscal year to December but can pick up in the last quarter as optimism on growth gains ground. Debt could see muted flows on Fed rate hike expectations but as global economy stabilizes and outlook for emerging economies improve, debt too should start seeing positive flows in 2017-18. Chart 8
CAD is likely to stay low given fall in oil prices and that would keep the INR stay relatively strong against the USD despite rate hikes by the Fed. INR has been one of the best performing currencies over the last one year despite falling against the USD.
INR has been a relative outperformer against the USD with respect to other global currencies. Table 2. INR is likely to stay stable given positive BOP position and would continue to outperform its peers in 2016.
Balance of Payments rose in the 2nd quarter of fiscal 2016-17 driven by rise in FDI and FII flows. Positive foreign flows indicate confidence among overseas investors in the Indian economy.
CAD (Current Account Deficit) rose to USD 3.4 billion (0.6% of GDP) in the 2nd quarter of fiscal 2016-17 from levels of USD 0.3 billion (0.1% of GDP) in the 1st quarter of fiscal 2016-17 and against USD 8.5 billion (1.7% of GDP) in the 2nd quarter of last year. The quarter on quarter rise in CAD is positive as it shows that the economy is seeing more activity. India’s being a growth economy should have CAD of over 2% of GDP.
Trade deficit was at USD 25.6 billion in the 2nd quarter of fiscal 2016-17 from levels of USD 37.2 billion last year and USD 19.24 billion in the preceding quarter.
FDI flows were USD 17.2 billion in the 2nd quarter against USD 4.1 billion in the 1st quarter of fiscal 2016-17 (against USD 6.5 billion last year) while FII flows were USD 7 billion against USD 1.2 billion (against USD 3.3 billion last year). India’s BOP (Balance of Payment) increased by USD 8.5 billion including valuation effect in the 2nd quarter against USD 3.3 billion including valuation effect in the 1st quarter (against decline of USD 0.9 billion last year). Excluding valuation effect, foreign exchange reserves increased by USD 4.8 billion in the 2nd quarter of fiscal 2016-17.
Monthly FII Net Investments
Global Macro
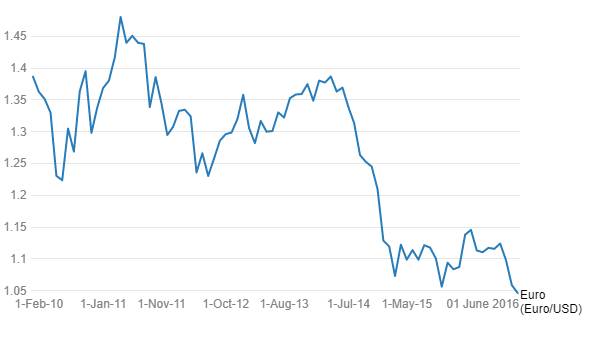
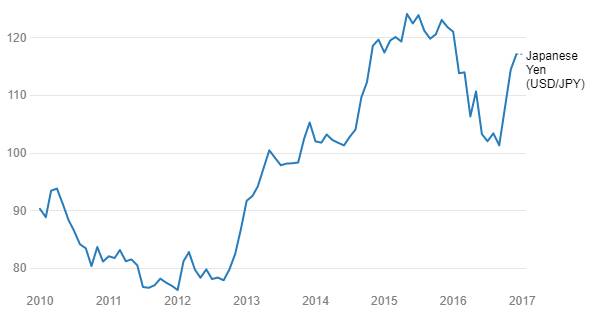
The outlook for global interest rates and global liquidity is extremely important for levels of yields on the ten year government bond. Global markets move on currency plays that in turn depend on Central Bank Policies. Going into 2017, interest rates are looking to rise while liquidity will stay high globally. This is despite the US Fed raising interest rates. The ECB and Bank of Japan are providing stimulus to their respective economies leading to the Euro and Japanese Yen trending down against the USD. Global markets will look to borrow in Euro and Yen to fund carry trades. Funding rates are expected to stay down for Euro and Yen borrowings. Charts 9, 10 & 11
On the global economy front, China saw weakness in trade and manufacturing even as inflation went up. The Chinese Yuan has been falling steadily since Trump victory in November and that could lead to more competitive currency going forward.
US economy saw steady pace of job growth with falling unemployment rate and rising consumer confidence. Eurozone saw falling unemployment rate and rising inflation which is good news for the ECB even as it maintains ultra loose policy. Japan is yet to see inflation and growth though a weak Yen that has fallen by over 12% since November could boost growth through exports.
Global bond yields have climbed since Trump victory in November. Table 3 Going into 2017, bond yields are likely to rise as growth optimism takes over markets. However bond yields will still stay far below peaks seen in 2007 as inflation is expected to stabilise at moderately higher levels given that the global economic growth is not expected to run away.
DXY (USD Index)
Euro USD
Japanese Yen (USD/JPY)
Credit Markets
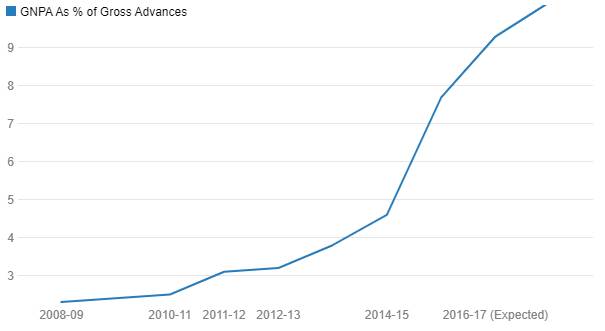
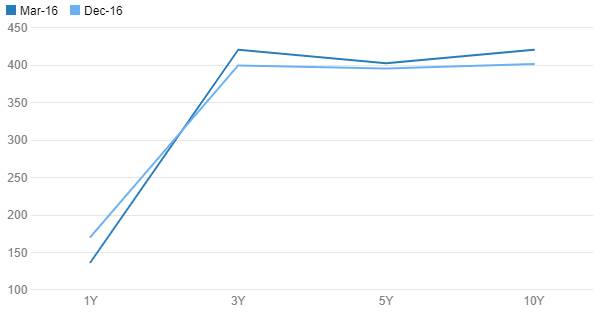
Credit spreads rose at the lower end of the rating scale on the back of sharp fall in government bond yields post demonetisation. Credit markets still witnessed stress as banks NPA issues continued into this fiscal year. Chart 13, Table 4.
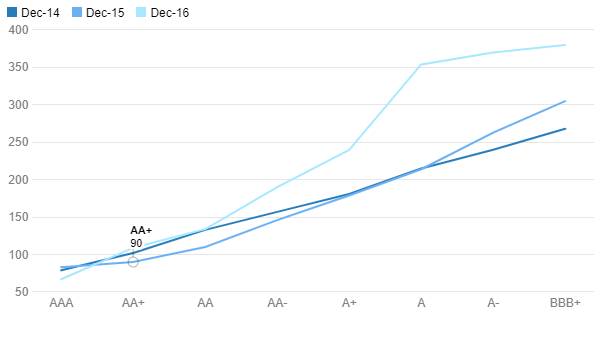
Credit spreads at the higher end of the rating scale were relatively calm as markets invested excess liquidity into corporate bonds offering high safety. Chart 12
Going into 2017, credit spreads are likely to stay stable for higher rated credits while spreads could fall for lower rated credits as the economy improves.
Global credit markets showed high volatility with junk bond yields and spreads rising sharply on the back of an overbought market turning jittery on Fed rate hikes. Chart 12 However credit spreads came off post Brexit and on expectations of higher economic growth post Trump victory.
3 Years Maturity Credit Spreads Chart
Banks Gross NPA Movement
Benchmark US High Yield corporate Bond Yields %
AA rated NBFCs Credit Spread Curve (in bps)
BBB rated NBFCs Credit Spread Curve (in bps)
Conclusion
The analysis of the key factors on Inflation, Fiscal Deficit, Current Account Deficit, INR and Global Macros suggest that the Ten Year Government Bond Yield will rise from current levels of 6.55% and trade within a range of 6.75% to 7.15% in the next fiscal year. There will be undershoots and overshoots of the yield given dynamic data driven markets. Credit spreads will fall at the lower end of the rating scale as prospects for economic growth improves globally and in India, leading to improved corporate health.
