RBI has revised rules for FPI (Foreign Portfolio Investor) investment in Government securities, giving preference to long term investor. RBI raised the FPI investment limit in Government securities by 4.7% to Rs 2.42 billion for the July-Septemeber quarter. As part of the additional limits, the RBI increased the limits for the general category by Rs 28 billion to Rs 1800 billion, and the limits for the long-term category by Rs 82 billion to Rs 543 billion. RBI said 75% of the future increases in limits for foreign investors will be allocated to a long-term category, and 25% for the general category. Earlier 60% was the limit for long-term investors.
FPI investments in Debt market was falling till December 2016, largely influenced by factors such as Brexit, US Presidential Elections, Fed Rate Hike Expectations and Demonetisation. Since December 2016, FPI exposure to Indian debt market increased substantially on the back of factors such as strengthening INR, political stability and rise in economic confidence. (Chart 1). For calender year 2017, FII have bought Indian debt worth USD 11.49 billion and as of 3rd July, FPI investments as percentage of limits utilised stood at 82.53% for Government securities.
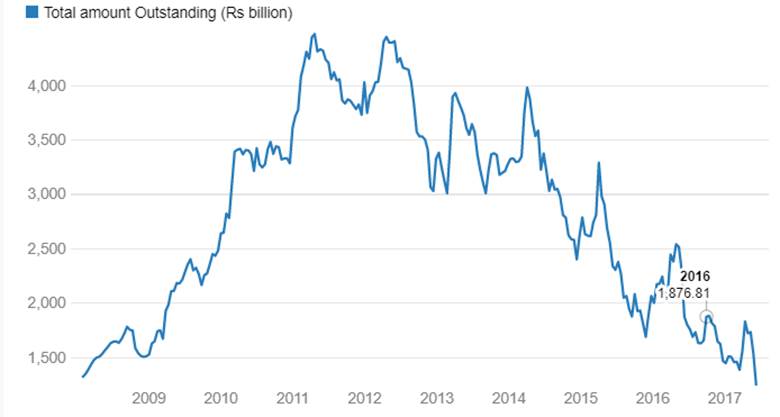
CD outstanding at the lowest Level since 2008
Certificate of Deposits (CD) outstanding amount has dropped to Rs 1251 billion in June 2017, the lowest level since 2008. Banks have cut down CD issuances on the back of liquidity surge on demonetization and on the back of low credit offtake. CD outstanding has dropped by 72% from peaks of Rs 4447 billion seen in the year 2012. In the last one year, CD outstanding fell 33% from Rs 1875 billion to Rs 1251 billion.
Fall in CD outstanding shows fall in demand for bank credit against good liquidity in the banking system. CD’s at the short end of the curve are trading at yields that are almost at par with treasury bills yields. Mutual funds are the largest investors in the CD market, holding 74% (Rs 927 billion) of total CD outstanding. Mutual Funds in absence of CD’s are parking excess liquidity in CP’s.
FII debt utilisation status stood at 85.96% of total limits. As on 30th June Corporate bond market trading volumes were 22.29% lower on weekly basis. Commercial Paper (CP) market trading volumes were 24.33% lower week on week and Certificate of Deposits (CD) volumes were higher by 73%.
Corporate Bonds Traded Levels
Three-year AAA corporate bonds were trading at levels of 7.24% as of week ended 30th June. Spreads were at 62 bps.Three-year AAA NBFC bonds were trading at levels of 7.51% with spreads 1 bps down at 89 bps levels. Three-year AA+ NBFC bonds were trading at levels of 7.80% with spreads 6 bps lower at 124 bps levels.
Five-year AAA corporate bonds were trading at levels of 7.27%. Spreads were at 56 bps,6 bps lower.Five-year AAA NBFC bonds were trading at levels of 7.55% with spreads at 3 bps lower at 84 bps.
Ten-year AAA corporate bonds were trading at levels of 7.40% with spreads 4 bps down at 78 bps. Ten-year AAA NBFC bonds were trading at levels of 7.59% with spreads 5 bps lower at 92 bps.
In the week ended 30th June,FIIs were net buyers of INR bonds for around Rs 37.01 billion for the week. Reported corporate bond traded volumes stood at Rs 142.76 billion with daily average volumes of Rs 28.55 billion. Volumes were 22.29% lower compared to the previous week.
CP traded volumes were at Rs 260.16 billion (24.33% less than previous week) with daily average volumes of Rs 52.03 billion. CD volumes were at Rs 104.30 billion (73.35% higher than previous week) with daily average volumes of Rs 20.86 billion.
Three months and twelve months PSU bank CDs were trading at 6.35% and 6.65% levels each at spreads of 3 bps and 30 bps respectively against T-bill yields. Three months’ maturity Manufacturing and NBFC sector CPs were trading at 6.40% and 6.70% levels respectively.
One-year maturity Manufacturing and NBFC sector CPs were trading at 6.98% and 7.15% levels respectively.
As on 30th June,FII debt utilisation status stood at 85.96% of total limits, 74 bps higher against previous week.FII investment position was at Rs 4304.17 billion in INR debt. FII investment position stands at Rs 2296 billion in gilt securities that also includes investment in Interest Rate Futures and at Rs 2162 billion in corporate bonds.
Certificates of Deposit - Total amount Outstanding (Rs billion)