
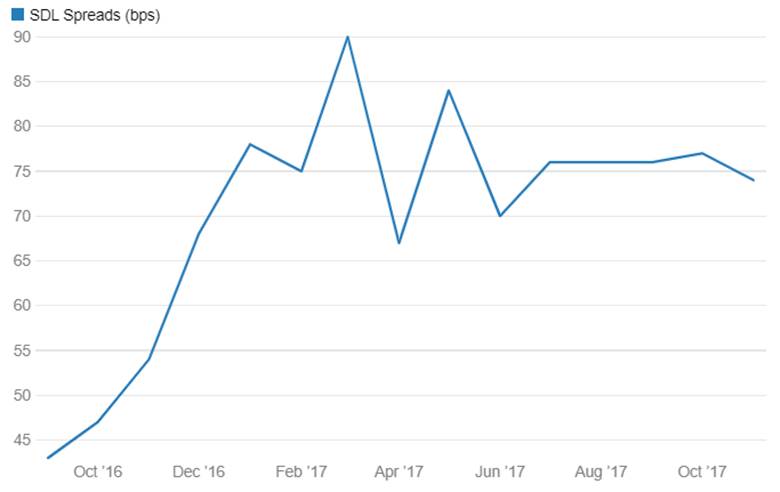
State Development Loans (SDL) are trading at spreads of around 70bps over the benchmark 10 year gsec. Given that credit risk in SDLs is almost non existent as the government supports states through loans when required and RBI provides overdraft facility, the question is should the spreads over gsec come off. SDL are also SLR (Statutory Liquidity Ratio) securities and RBI accepts SDL for repos.
SDL supply has risen 4x since fiscal 2008-09 and adding UDAY bonds the supply has risen by almost 5x. Recent farm loan waivers totaling over Rs 2000 billion, if funded through issue of bonds would also add to the supply.
In fact SDL supply could even overtake gsec supply adding UDAY bonds and if farm loan waiver bonds are issued. SDL redemptions are at over Rs 1000 billion from next fiscal onwards and gross borrowing will rise sharply on the back of redemptions.
SDLs are not as liquid as gsecs as they are not seen as trading bonds by traders. Banks and insurance companies are buy and hold investors while mutual funds hold them on opportunistic basis. FII limits have just opened up for SDL’s but utilization is low.
Given supply, spreads are likely to be on the higher side but market could have trading opportunities when liquidity and search for yields are high.
FII Investment Limit in SDL
Instrument Type | Eligible Foreign Investors | Upper Limit (Refer to Note 1) | Investment (INR Billon) | Total Investment (INR Billion) | % of Limits Utilised (INR Billion) | Limit Available for Investment (INR Billion) |
State Development Loans (Refer to Notes 6) | All Categories | 285 | 14.70 | 14.70 | 5.16 | 270.03 |
State Development Loans (Refer to Notes 6) | Long Term FPIs | 46 | 0 | 0 | 0 | 46 |
Budget Estimates: 2017-18
As per RBI, the GFD-GSDP (Gross Fiscal Deficit- Gross State Domestic Product) ratio is budgeted at 2.6% during 2017-18 compared with 3.4% during 2016-17 (Revised Estimate). However, there are many factors which can pull up the GFD-GSDP ratio, factors such as the implementation of states own pay commission, farm loan waiver, and revenue uncertainty on account of the implementation of GST.
Way Forward: Even as the Central Government makes significant efforts toward fiscal consolidation, the accumulation of liabilities could result in higher debt burden of the states unless immediate steps are taken to contain them. A rising general government debt-GDP ratio is also detrimental from a sovereign rating perspective. However, GST is expected to be a game changer. The successful implementation of GST will result in additional revenue. The GST is expected to reduce administrative costs for collection of tax revenue and improve revenue efficiency. It will also lead to increase in the shareable pool of resources, resulting in larger central transfer to the states which, in turn, will enable them to undertake much needed developmental expenditure. Such an outcome would ensure debt sustainability for states in the long term.
SDL: The yield on state government securities moderated to 7.25% in June 2017 from 7.97% in June 2016. The spread of yields on State Development Loans (SDLs) over the benchmark 10-year G-sec yield increased sharply to 70 bps in June 2017 from 44 bps in June 2016. Going forward SDL movement will depend on two factors, 1st successful GST implementation and 2nd Fiscal discipline maintained by the state governments.
The yields on UDAY bonds also fell sharply by 82-99 bps over the last one year, Spreads of yields on UDAY bonds over the benchmark 10-year G-sec has increased sharply to 95 bps in 2017 from 75 bps in 2016.
Spread Between 10-year Gsec & 10-year SDL
Maturity Profile of Outstanding State Government Securities: As at end of March 2017, 68.0% of the outstanding SDLs were in the residual maturity bucket of five years and above. The redemption of special securities (UDAY) issued under financial restructuring plans (FRPs) for state-owned Discoms entails large repayment obligations from 2018-19. Special securities issued under FRPs are significantly larger in size; consequently, repayment pressure will be aggravated from 2018-19.
Maturity Profile of Outstanding State Government Securities
FY | Amount (Rs Billion) |
2016-17 | 393.3 |
2017-18 | 743.30 |
2018-19 | 1,216.9 |
2019-20 | 1,335.80 |
2020-21 | 1,074.4 |
2021-22 | 1,585.7 |
2022-23 | 1,650.7 |
2023-24 | 1,950.30 |
2024-25 | 2,316.70 |
2025-26 | 2,873.4 |
2030-31 | 20 |
Total | 15,160.5 |
State Government Market Borrowings
State Government Market Borrowings | Gross (Rs Billion) |
2000-01 | 133 |
2001-02 | 187.10 |
2002-03 | 308.5 |
2003-04 | 505.20 |
2004-05 | 391 |
2005-06 | 217.3 |
2006-07 | 266 |
2007-08 | 805.7 |
2008-09 | 1,290.80 |
2009-10 | 1,181.9 |
2010-11 | 1,572 |
2011-12 | 1,678.60 |
2012-13 | 2,187.1 |
2013-14 | 2,506.10 |
2014-15 | 2,698.4 |
2015-16 | 2,945.60 |
2016-17 | 3,686.77 |
2017-18* | 4,180 |
State Finances: A Study of Budgets
A RBI report on State Finances: A Study of Budgets, reveals combined deficit of state reached 3.6% of GDP in 2016 which is significantly higher than 2.6% of GDP in 2015. The fiscal deficit to GDP ratio breached the 3% ceiling of fiscal prudence for the first time since 2004-05. This happen largely due to significant increase in capital outlay and loans and advances to power projects.
Capital expenditure expanded by 1% of GDP in 2015-16 with development expenditure rising faster than non-development expenditure. (expenditure which is related to economic development is called development expenditure while expenditure incurred for normal running of government is non-development). Within developmental capital outlay, sectors which saw significant growth were major and medium irrigation and flood control, energy, and roads and bridges, reflecting the intent to create growth-enabling infrastructure.
Loans and advances for power projects increased significantly as an outcome of UDAY scheme, under this scheme states took over 75% of DISCOM debt, states bought 50% of debt in 2015-16 and remaining 25% in 2016-17. In return, states issued UDAY bonds in the market directly to banks / FIs holding the discom debt. Read our note UDAY Bonds.
Net of these bonds, the consolidated state GFD-GDP ratio gets moderated by 0.7 percentage points during 2015-16 to 2.9 per cent from 3.6 per cent in the previous year.
