
In the first half of 2017, prices for most industrial commodities strengthened while crude oil prices declined on uncertainty over commitment to the OPEC and non-OPEC cuts, larger-than-expected US crude oil inventories, robust recovery in U.S. shale oil activity and talks of sale of US strategic reserves. Global agricultural commodities prices were broadly stable while industrial metal prices rose. The outlook for commodities is mixed for the second half of 2017 with select commodities expected to do well.
Commodity prices bottomed out in 2016 as markets factored in better growth prospects for the US. Eurozone too is witnessing economic recovery, albeit muted while China growth looks to have bottomed out at lower levels.
Outlook for commodities is better than what it was in the past few years. Commodity prices have hardly recovered from peaks seen in 2007, which was the peak of a commodity price bubble, but after having fallen to extreme lows, prices can move up on better demand supply equation.
Industrial metals would outperform oil, gold and agri commodities in the second half of 2017. The reason is that the US would spend on infrastructure if Trump follows up on his campaign promise. A limping back to normal Eurozone too would call for higher demand while the world’s larget consumer of commodities, China, will see demand stabilising at lower levels as the country’s growth bottoms out.
Global oil market is expected to align to steady growth in demand and lower production from OPEC and non-OPEC countries. Currently oil is definitely in oversupply as US shale oil production has lowered US oil imports and drive for clean energy has reduced demand for fossil fuels. Oil prices are unlikely to rise sharply from current levels of around USD 50/bbl.
Gold will struggle for direction as inflationary threats are down on muted global growth and central banks are slowly turning policy neutral.
Commodity Price Performance in 2016
Year 2016 was positive for most of the commodities and prices have shown uptrends. Gold, silver and crude oil prices have risen by 5%, 13% and 46% from December 2015 levels.
Three events that took place in 2016 will influence commodity prices in 2017.First is election victory of Donald Trump in the US Presidential Elections. Trump administration is expected to adopt expansionary fiscal policies, which will boost inflation and growth in the US economy.
Second event is agreement between OPEC and Non-OPEC countries to cut oil production, which will give an upward bias to crude oil prices. However US shale oil production will restrict oil price uptrend.
The third event is Fed rate hikes. Fed has indicated 3-4 rate hikes in 2017 . Rising interest rates could have overall negative implications for commodity prices, as investors seek yield-bearing assets such as bonds or equities. Sustainable high interest rates reduce the price of storable commodities by increasing the incentive for extraction in present instead of future, boosting the pace at which oil or other commodities are produced. High rates also decrease firm’s desire to carry inventories. It indicates that commodity prices will be driven by expected consumption demand rather investment purposes in 2017.
In the past, in the 1980’s US real interest rates sharply increased and dollar commodity prices tumbled while in the 1970 and 2002 periods real interest rates fell followed by rising commodity prices.
Crude Oil
Brent crude (USD/bbl)
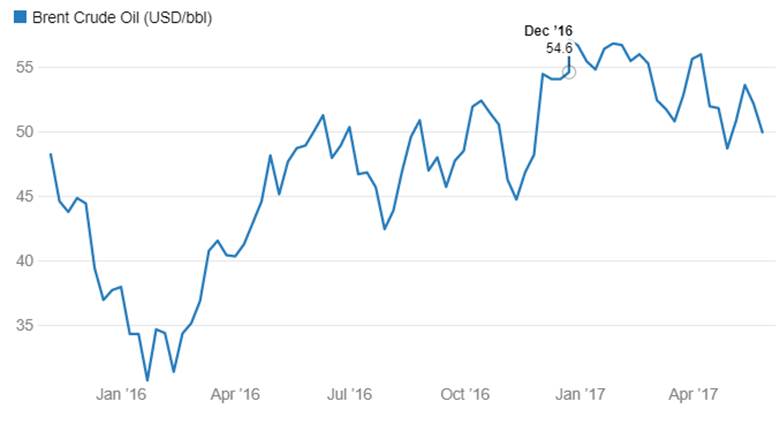
Crude oil prices declined around 4.38% in the last one year. In 2017 crude oil inventories have remained high, mainly in the US. The fact is that with US exploiting its shale oil reserves, there is a huge oversupply of oil in the world. US is more likely to become self-sufficient in oil and that will leave a huge gap in demand for the oil exporters. There is also a significant trend globally for clean energy and that too is hurting consumption of oil.
A few of the OPEC influencing crude oil prices events are given below.
In 1973, OPEC decision to impose an embargo on oil exports lead to quadrupling of its official oil prices—from USD 2.70/bbl in September 1973 to more than USD 10/bbl in 1974.
Substantial loss of Iranian oil during the 1989-90 revolution, oil prices spiked to over USD 40/bbl, but OPEC decided to set its official price of Saudi Light Oil at USD 34/bbl.
The last 3 decades saw oil prices driven by OPEC individual member quotas, oil demand and non-OPEC supply. Production cuts in 1998-99 during the East Asian financial crisis and 2008-09 during the deep global recession lifted oil prices.
The top five oil producing countries are: Saudi Arabia, Russia, United States, Iran, and China. The top five oil consuming countries are: United States, China, Japan, Russia, and Germany.
U.S. Ending Stocks of Crude Oil and Petroleum Products (Thousand Barrels)
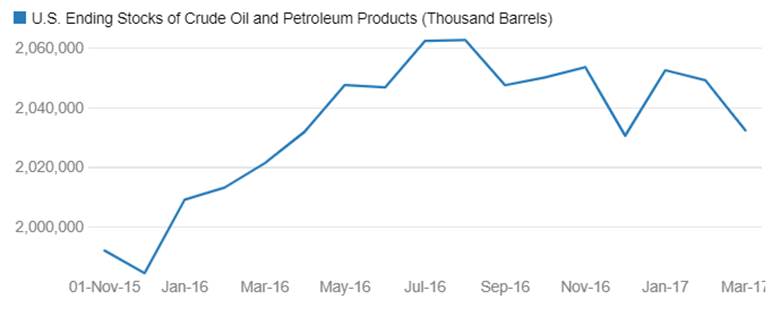
US oil production has grown rapidly in the recent years with the U.S. Energy Information Administration (EIA) data reflecting combined production rise from 225 million barrels per month in Feb 2014 to 260 million barrels levels per month in 2016. US oil stock pile increased 3.5% in 2016. In December 2016, US oil stocks were at 2037 million barrels against 1968 million barrels in December 2015. The increase in the stock pile of oil can keep the crude oil prices in check in the near term.
Thompson Reuters/Jefferies CRB Index (CRB Index)
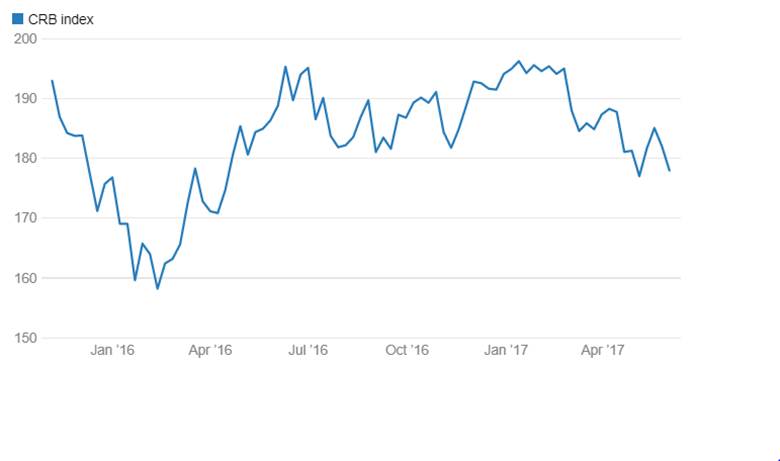
The Thompson Reuters/Jefferies CRB Index (CRB Index) is a commodity index that tracks a basket of 19 commodities that are traded on the NYMEX, CBOT, LME, CME and COMEX Exchanges.
The CRB commodity Index has declined around 8.36% in the last one year since June 2016 showing muted movement in commodity markets. The commodity index has weights of 23% in crude oil and 12% in industrial metals such as Aluminum and Copper. The index peaked in 2007 at levels of 450 before dropping all the way down to 160 indicating a commodity bubble bust that can take a long while to recover.
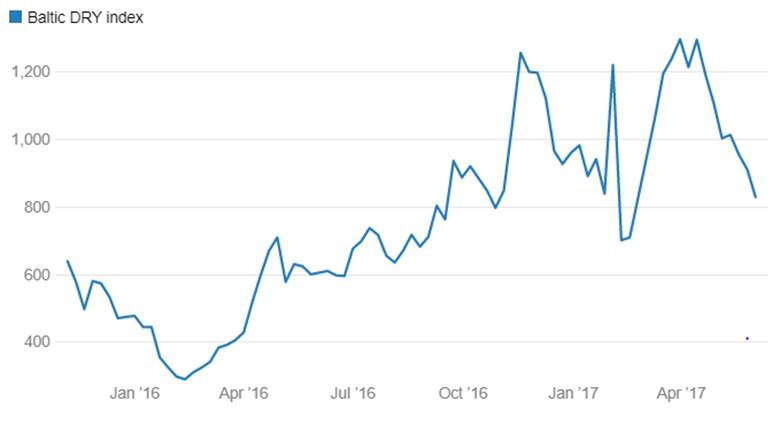
Baltic Dry Index
In the last one year the Baltic Dry Index has risen 39% against June 2016 levels. The Baltic Dry Index (BDI) measures the pulse of world trade as it reflects the rates for chartering the giant ships that transport iron ore, coal and grain.
Baltic Dry Index is affected by the number of ships available to transport raw materials globally. Typically the number of ships cannot be easily manipulated or disrupted as ships usually take years to build and once built it is expensive to keep them inactive.
The Baltic Dry Index is affected by the demand of commodity consumers who need the raw materials for production. Producers buy commodities when they begin work on heavy machinery, roads, large infrastructure projects and for other finished goods . Producers skip buying raw materials when they pause work on infrastructure projects or have huge pile up of unused inventory.
Movement of Baltic dry index is based on two factors, one- global trade that measures demand for shipping and two – supply of vessels. In early 2016 the index bottomed out around 300 levels as demand for shipping commodities was very weak but in the lattr half of the year, the index gained reflecting improved global economic activity. Blatic Dry Index will see a gradual rise in 2017 as demand for industrial commodities improve.
Gold
January 2017 saw gold prices rising on strong investment demand amid geopolitical and economic uncertainty, perception as a safe haven asset,rising global tensions surrounding Afghanistan, Syria, and North Korea; the deterioration of U.S and Russia relations and uncertainty about inflation, deficits, and the level of the dollar. Gold prices have shown muted movement on a one year basis and are down approximately by 1.20% since June 2016. Gold prices peaked in July 2016 at 130 USD/oz on the back of Brexit, but then fell sharply as Brexit fears eased and on the back of US presidential election outcome in early November 2016. Gold is considered as a hedge against inflation and a safe haven asset in times of crisis points in the global economy. The credit bubble bursting in 2007-08 provided a good crisis point for gold as it lead to many issues such as sovereign debt crisis in the Eurozone and rising inflation expectations in emerging economies as global central banks pumped in money to bring markets under control.Since
Overall rising interest rates is negative for gold prices, as investors shift to higher yield-generating assets.
Gold has tendency to perform better in rising risk aversion situations. Gold will be range bound unless there is a fresh crisis point in markets. At this point of time that crisis point is not seen on the horizon. U.S. President-elect Donald Trump administration is expected to adopt expansionary fiscal policies, which will boost inflation and growth in the economy which is positive for high yielding assets.
Physical gold demand has been very weak in 2016,and fell in the two largest consuming countries, India and China. India is among the world’s biggest gold consumers after China and the US. In 2016 Government of India issued gold schemes such as Sovereign Gold Bond Scheme and Gold Monetization Scheme to curb demand for physical gold. If government of India efficiently implements these schemes, India’s gold import can be lower in the coming years.
Silver prices have declined 1.26% in the last year, movement is attributed to stable investment demand.Physical demand has risen by strong photovoltaic production in China, but in 2016 consumer silver consumption was weak in China and India.
Silver prices had shot up five fold in the 2009-2011 period on the back of worries over the collapse of the Euro and the Eurozone and on the back of inflation worries in emerging markets. But post the crisis, the perceived value of Silver as a currency and inflation hedge has falling sharply
Silver prices are likely to be range bound and sharp rise in the metal price is not seen.
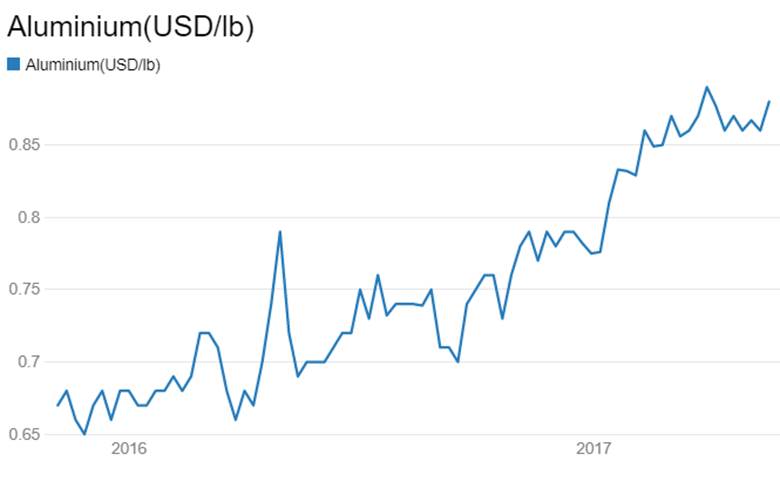
Aluminum is among the largest consumed metals globally. It plays an important role in any country’s economic growth as it has wide applications in key sectors such as Power, Automotive, Construction, Consumer Durables and Packaging.
Base metal Aluminum price has increased by 16% against June 2016 levels.Falling LME inventories, rising demand, and production cuts in China as they closed high cost capacity facilities led to rise in aluminum prices. However new low cost capacities in China have started and this could equalize the demand supply balance. China is the major demand driver for aluminum. Infrastructure spending in the US, drawdown of Chinese inventories and production rationalisation will lead to firm aluminum prices in 2017.In March 2017 a new Chinese law went into effect, which required aluminum smelters in four northern provinces to cut output by 30 percent over the winter heating season to reduce pollution and this can lead to price rise.
Copper
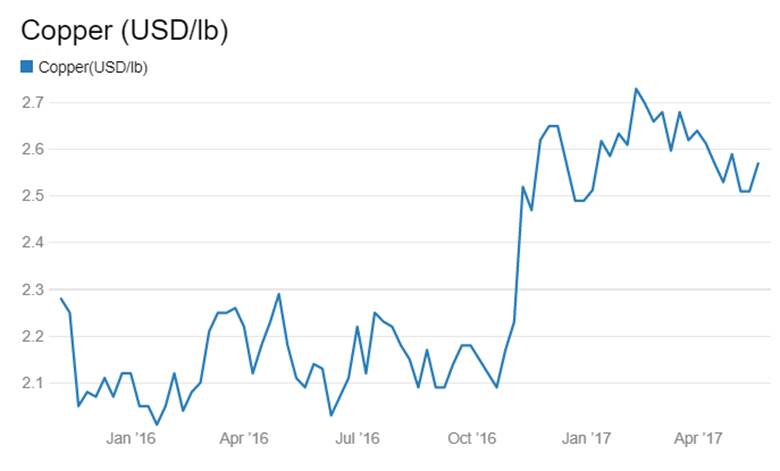
Copper is the third largest consumed metal in the world after steel and aluminum. Copper is used as electrical conductor, construction material and as components in telecommunications, auto and alloys.Copper outlook largely depends on the demand from emerging economies in Asia, specially China.
In the last one year copper prices rose 26% given strong demand from China construction sector and power grid construction work.In second half of 2017 copper prices are expected to increase because of disruptions at some of the world’s largest mines— labor strikes in Chile, export policies of Indonesia and bad weather in Peru.
Copper prices in 2016 had bottomed out to six year lows before trending higher. Prices fell sharply on record production.
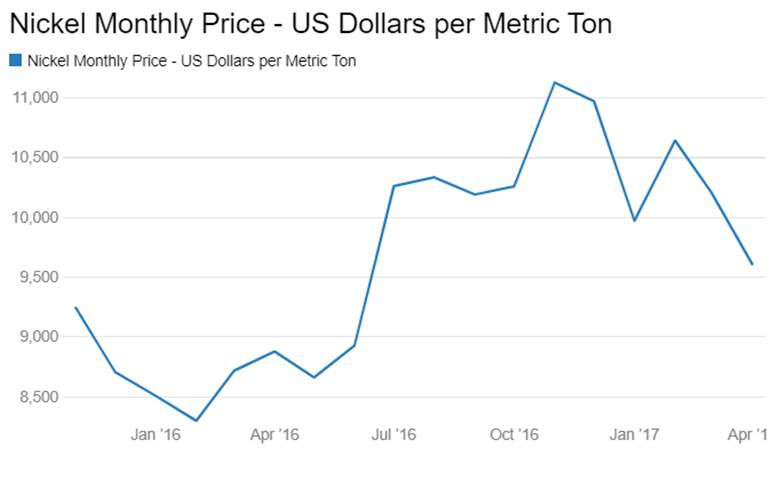
Non – ferrous metal Nickel prices have risen by 7.6% in the last one year .
Nickel is an important raw material for steel and its products. Prices have increased, as in January 2014, Indonesia banned ore exports affecting nickel export flows while Philippine government suspended 55% of nickel mines for environmental violations, which is 10% of global production. Nickel prices will be driven by policy developments in the Philippines and Indonesia. Recently Indonesia signalled that it intends to revisit its January 2014 ore export ban, which may allow companies to export ore.
Non – ferrous metal Zinc prices have rallied 24% in the last one year due to ongoing supply disruptions from mine closures and voluntary mine production cuts against strong steel demand. Mines are closed due to exhaustion and price driven production cuts. The gains were also attributed to strong demand fpr galvanize steel and a tightening concentrate market owing to large mine closures in recent years. Zinc is an important raw material in galvanised steel, batteries and its products. Large zinc mines are to be closed in 2017-18 too and zinc prices could rise steadily.
In the last one-year lead prices rose by 24%. Major source for lead is the by-product of zinc mine production or recycling of used batteries. Increasing demand for batteries in stop/start vehicles and higher seasonal demand for batteries lifted lead prices (Around 60% of lead supply is from secondary sources, recycled batteries 40% and scrap 20%, which makes lead less susceptible to mine closure price effects.)
Lead faces demand challenge from a maturing e-bike sector in China and greater penetration of alternate, cleaner, and more efficient battery technologies. Hence long term lead outlook is muted. Zinc mine closures and vehicle sales trends will determine lead prices in 2017.
Agricultural commodities
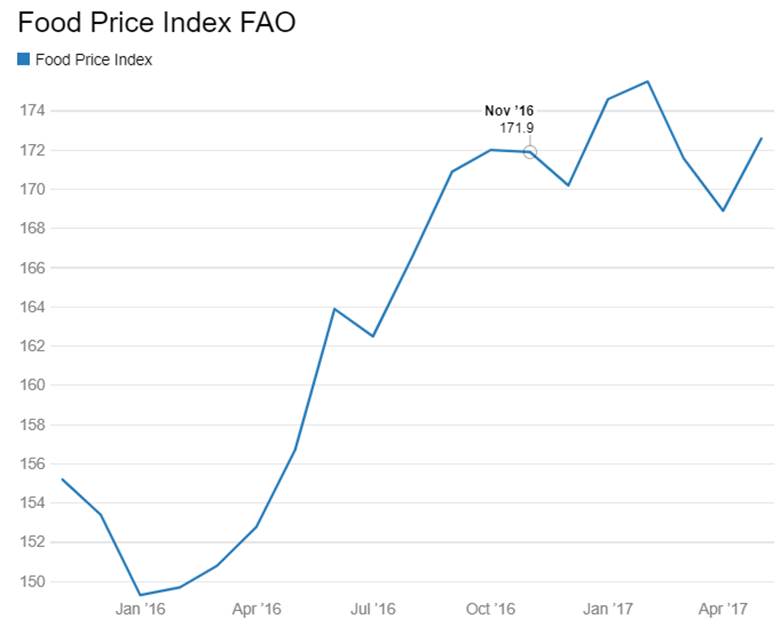
Agricultural commodities index (The FAO Food Price Index) has shown an uptrend in the last one year, rising by 5.88%.
Against June 2016 levels Wheat and rice prices declined 11.53% and 10.95%. The market expects record surplus production levels for wheat in 2017-18.
Long term and short term factors that determines agri products price movements are:
Weather related factors. El Nino and La Nina are weather patterns, which affects agricultural production. El Nino adversely affects agricultural production in the Southern Hemisphere, especially countries in Latin America and East Asia, South Asia and Australia. La Nina adversely affects agricultural production in the Northern Hemisphere, but its effect is less than El Nina. Active La Nina is expected to persists in 2017.
Many governments are shifting from policies of reducing consumer prices to those supporting higher farmgate prices and that could boost production.
Falling energy prices have positive impact on agri products cost and production levels.
Apart from supply demand dynamics agricultural commodities prices outlook will depend upon energy prices as most agricultural commodities prices are impacted directly through fuel and other energy costs and indirectly through various chemicals and fertilizers costs.
Commodities | 09-06-2017 | 02-06-2017 | 09-06-2016 | Weekly Return(%) | Yearly Returns(%) |
CRB index | 176.76 | 177.97 | 192.89 | -0.68 | -8.36 |
Baltic DRY index | 849 | 830 | 609 | 2.29 | 39.41 |
Brent Crude Oil (USD/bbl) | 48.15 | 49.95 | 50.35 | -3.6 | -4.37 |
Gold (USD/Oz) | 1,271.4 | 1,279.82 | 1,286.9 | -0.66 | -1.20 |
Silver(USD/Oz) | 17.22 | 17.52 | 17.44 | -1.71 | -1.26 |
Lead (USD/lb) | 0.94 | 0.95 | 0.76 | -0.56 | 24.01 |
Aluminium(USD/lb) | 0.86 | 0.97 | 0.74 | -11.34 | 16.44 |
Copper(USD/lb) | 2.62 | 2.56 | 2.08 | 2.40 | 25.98 |
Zinc(USD/lb) | 1.14 | 1.14 | 0.91 | -0.06 | 24.3 |
