
10 year Gsec to 10 year UST Spreads
The spreads between the 10 year gsec and 10 year UST are at levels of around 460bps. Spreads peaked at 690 bps in May 2012. Will the spreads go down further or will it rise?
Spreads can go down further largely on the back of faster rising yields on the UST. Fed is on a rate hike path while the Trump administration is expected to cut taxes at the cost of fiscal deficit, which will place pressure on the 10 year UST.
10 year gsec yield is unlikely to rise sharply from current levels of 6.95% given that the government is on track to keep down fiscal deficit at 3.2% of GDP for this fiscal year against 3.5% of GDP seen in fiscal 2016-17. RBI has turned neutral on policy after lowering repo rates by 175bps over the last two years. RBI policy neutral stance is based on their target of CPI inflation at around 4%.
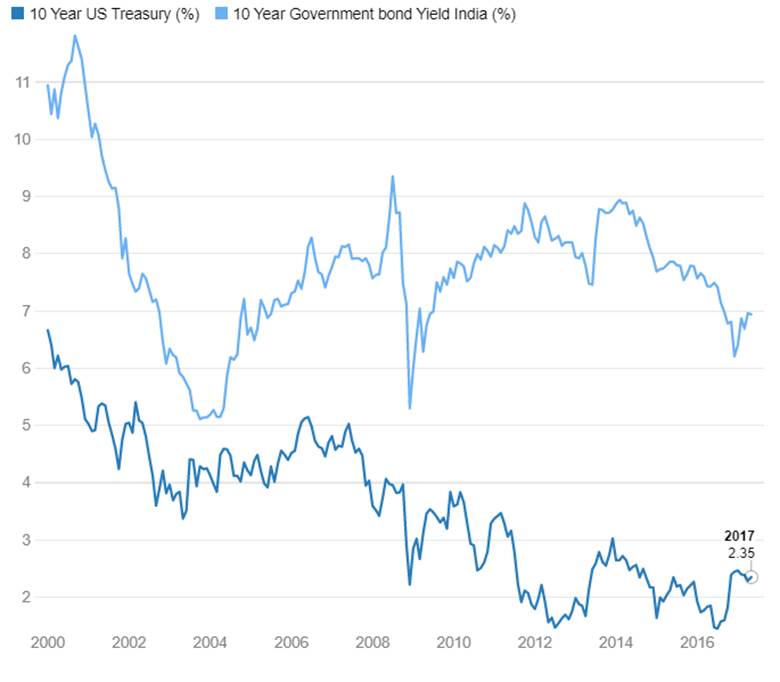
10 Year G-sec Vs 10 Year US Treasury
10 Year G-sec Vs 10 Year US Treasury Spreads (bps)
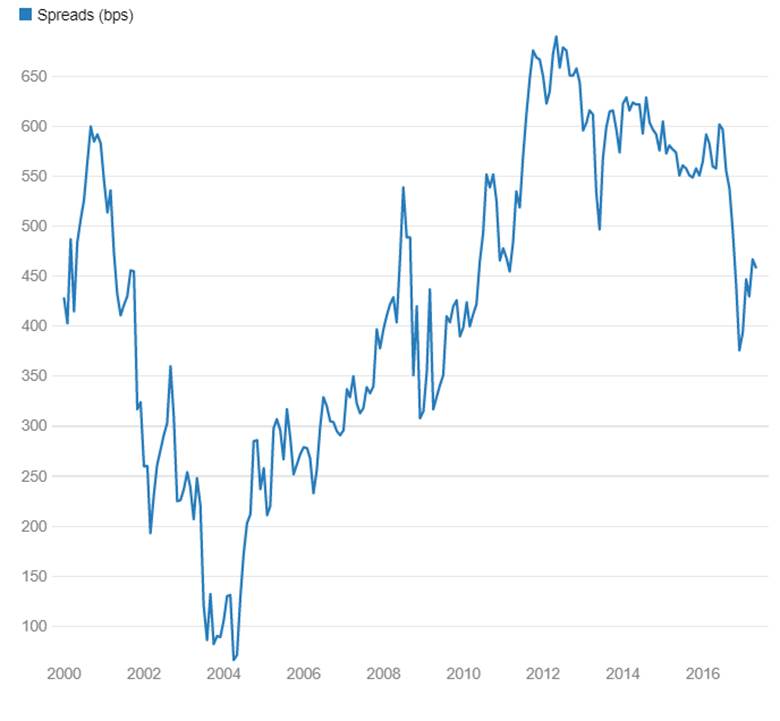
Spreads between 10 year UST and 10 year gsec have seen wide movements. Spreads touched lows in April 2004 at 61 bps. Spreads touched highs in May 2012 at 690 bps. Post 2017 US elections, spreads have fallen sharply as 10 year UST yields headed North due to Trump reflation factor while 10 year gsec yields heading south on demonetization.
10 year Gsec to Repo Rate Spreads
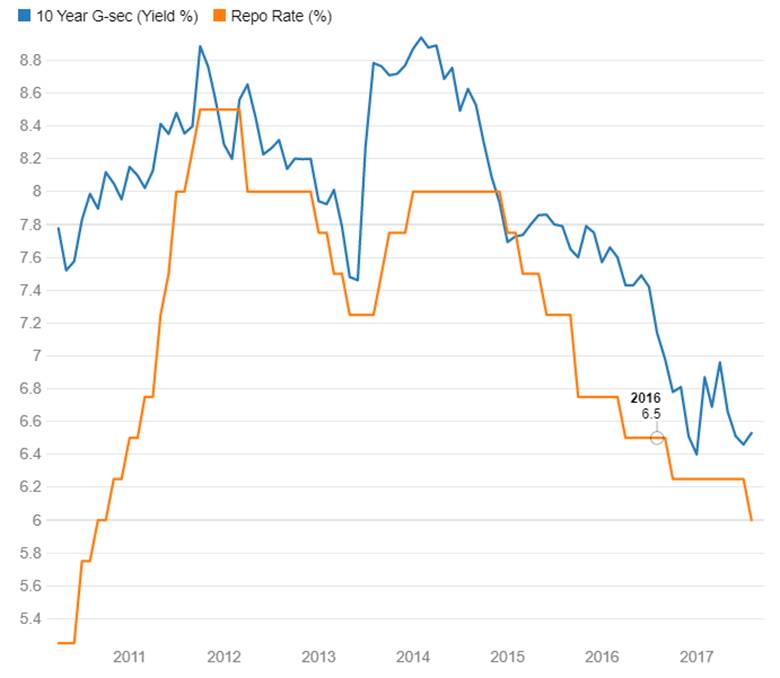
The 10 year gsec to Repo Rate spread is at around 70bps. Spreads have risen from negative levels post demonetization in November 2016. The 10 year gsec largely front runs the Repo Rate and will rise or fall depending on markets expectation of RBI policy action.
At this point of time, market outlook for Repo Rate is more towards stability and a low probability of a rate hike. Spreads are likely to hover around current levels unless markets start factoring in a higher probability of rate hikes.
10 Years G-sec Vs repo rate (%)
10 Years G-sec Vs repo rate spreads (bps)
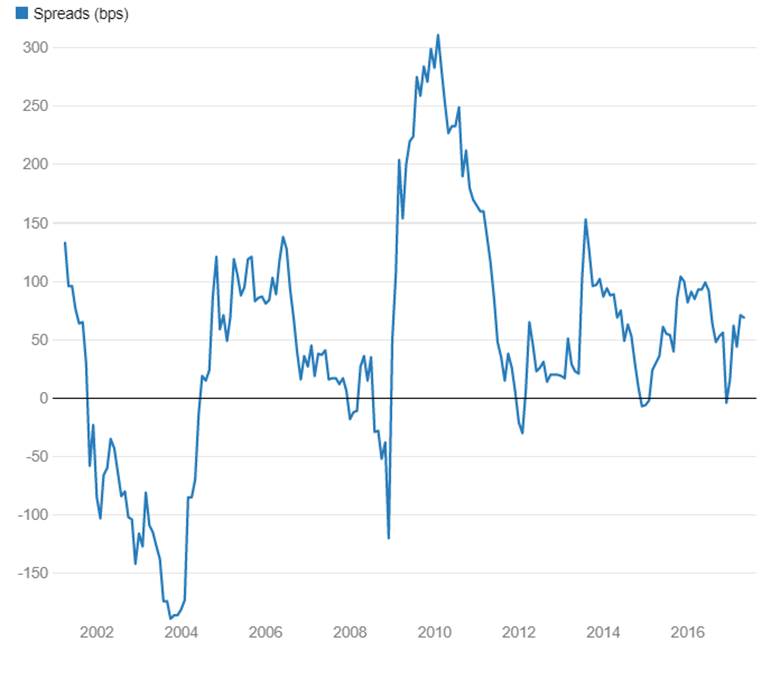
Spreads between 10 year Gsec and repo rate have seen wide movements. Spreads were lowest in year 2003, spreads touched levels of -189 bps in October 2003 and spreads were highest in 2010 where spreads touched levels of 311 bps in February 2010.
