
Sensex & Nifty started 2022 on strong positive note as they recorded 2.5% gains for the week, amid positive FIIs flows. Fed minutes showed policymakers are planning to hike rates 3 times this year starting from March 2022. Also, Fed is planning to double the pace of balance sheet reduction and it is expected to be USD 100 billion per month. Global bonds & equities reacted negatively to the Fed minutes. UST touched 2020 pre-pandemic highs of 1.78% and domestic G-secs witnessed pandemic highs of 6.54%. Higher bond yields would have a negative impact on equities. Sensex & Nifty will react to Q3Fy22 earnings which will be reported from this week and, inflation data will be keenly watched. Global investors will watch out for inflation data from US and Eurozone.
FIIs/FPIs have sold Rs. 190 billion in December 2021 and invested Rs. 32 billion in January 2021. Foreign Institutional Investors (FIIs) Derivative Statistics have shown a rise in the open interest (OI) in stock futures, index options, stock options and fall in OI for index futures.
Wallstreet indices closed on mixed note on Friday, as the market reacted sideways to the NFP data. US created below than expected jobs in December 2021, however, unemployment rate fell to 3.9% which is close to pre-pandemic levels. Wage growth was recorded at 4.7%. Investors digested the fact; mixed economic data points won�t halt Fed�s rate hikes in 2022. During the week, Dow Jones fell by 0.30%, Nasdaq slumped by 4.50%, and S&P 500 declined by 2.11%.
European markets closed on mixed note on Friday amid weak economic data from Eurozone. Preliminary estimates showed Eurozone inflation would touch 5% for the month of December 2021. Industrial production in Germany and France unexpectedly contracted in November 2021. During the week, DAX up by 0.40 % and FTSE gained by 1.35%.
Gold prices accelerated back to USD 1800 per ounce levels amid reported US mixed economic data. Prices corrected by 2% during the week as the Fed minutes showed policymakers would start rising the rates from March 2022 and reduce the balance sheet size.
Global Economy
The US unemployment rate dropped to 3.9%, the lowest since February 2020, pointing to a sustained recovery in the job market helped by a fast-recovering economy and strong demand for labor. The rate was still slightly above pre-crisis levels. The US economy added a meagre 199,000 jobs in the last month of 2021, well below market forecasts of 400,000.
The US trade deficit increased to USD 80.2 billion in November of 2021 from an upwardly revised USD 67.2 billion gap in October 2021 and close to a record high of USD 81.4 billion in September 2021. Imports up by 4.6% and exports rose marginally by 0.2%.
The number of Americans filing new claims for unemployment benefits increased by 7,000 to 207,000 in the week ending 01st January 2022 from an upwardly revised 200,000 in the previous period and compared to market expectations of 197,000.
The US ISM Services PMI fell to 62 levels in December 2021 from a record high of 69.1 levels in November 2021, well below market forecasts of 66.9 levels.
US crude oil inventories fell by 2.144 million barrels in the week ending 31st December 2021, a sixth consecutive period of declines.
Annual inflation rate in the Euro Area accelerated for the sixth straight month to a record high of 5% in December of 2021 from 4.9% in November 2021 (preliminary estimate).
The IHS Markit Eurozone Services PMI came in at 53.1 level in December 2021, and down from November2021 level of 55.9.
Japan Services PMI was revised higher to 52.1 levels in December 2021, from 53 levels in November 2021, which was the highest reading in 27 months.

Equity Indices | 07-12-2021 | 31-12-2021 | % Change week on week |
Indian Indices | - | - | - |
Nifty | 17812 | 17354 | 2.64% |
Sensex | 59744 | 58253 | 2.56% |
CNX Midcap | 31111 | 30443 | 2.19% |
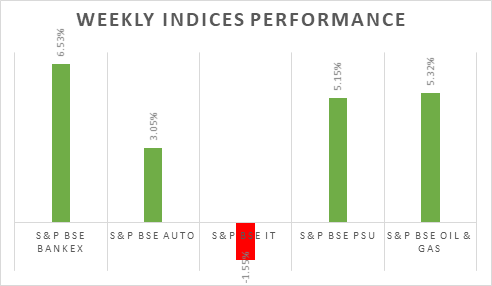
Bank Nifty | 37739 | 35482 | 6.36% |
CNX Infra | 5091 | 4950 | 2.85% |
CNX IT | 38139 | 38701 | -1.45% |
Derivatives Nifty Near month | 17855 | 17420 | 2.50% |
Spread over underlying | 43 | 66 | -34.85% |
Traded Contract Rs crores | 15877 | 12102 | 31.19% |
Implied Volatility Put | 16.81% | 16.54% | 1.63% |
Implied Volatility Call | 13.41% | 13.33% | 0.60% |
Global Market indices | - | - | - |
Nikkei 225 | 28478 | 28792 | -1.09% |
Hong Kong Hangseng | 23493 | 23397 | 0.41% |
China Shanghai Composite | 3579 | 3639 | -1.65% |
Korea Kospi | 2954 | 2977 | -0.77% |
German DAX | 15947 | 15885 | 0.39% |
UK FTSE | 7485 | 7385 | 1.35% |
Dow Jones Industrial | 36231 | 36338 | -0.29% |
Nasdaq | 15592 | 16320 | -4.46% |
Currency Market | - | - | - |
USD/INR Rs | 74.46 | 74.48 | -0.03% |
EUR/USD USD | 1.1361 | 1.1371 | -0.09% |
USD/JPY JPY | 115.54 | 115.07 | 0.41% |
USD Index DXY | 95.74 | 95.67 | 0.07% |
Commodities Market | - | - | - |
Brent Crude Oil (USD/Barrel) | 81.75 | 77.78 | 5.10% |
Gold (USD/ Oz) | 1797 | 1829 | -1.75% |