The bond market is hit by negative factors from all sides, falling INR, negative BOP for the 1st quarter of fiscal 2018-19, rising fuel prices, RBI rate hike expectations in October, higher probability of more Fed rate hikes, risk aversion on global trade tensions and impending higher government bond supply starting October 2018. None of these factors are looking to ease in the near term and this will keep bond yields under pressure.
Bond yields rose across the curve and across segments on the back of the INR falling to below Rs 72 to the USD. 10 year benchmark government bond yields rose to 4 year highs while OIS, money market securities and corporate bond yields followed the rise in the 10 year gsec yield. Bond yields will stay pressured until RBI policy in October, after which, depending on levels, the market may choose to buy into higher yields.
India’s 1st quarter fiscal 2018-19 balance of payments turned negative, as capital flows were weak while current account deficit rose on higher trade deficit. Read our note on India’s 1st quarter fiscal 2018-19 CAD. Fx reserves fell on negative BOP, which leads to a liquidity drain as well as weaker external debt ratios. RBI has been a net seller of USD this fiscal year and this selling has drained out liquidity. Liquidity fall through fx has been compensated by government spending and RBI bond purchases, but this may have a longer term impact on yields as structural liquidity can turn negative.
US jobs report for August 2018 came in positive with more jobs added than expected and wages growing stronger than expected. US treasury yields rose in anticipation of more Fed rate hikes, which can put further pressure on the INR and on bond yields.
Higher global oil prices and falling INR have contributed to retail fuel prices rising, leading to rise in inflation expectations. Trade war tensions are staying high on posturing from all countries concerned and this is leading to risk aversion and negative capital flows, which is pressurising corporate bond yields as market is worried about the liquidity effects of capital outflows.
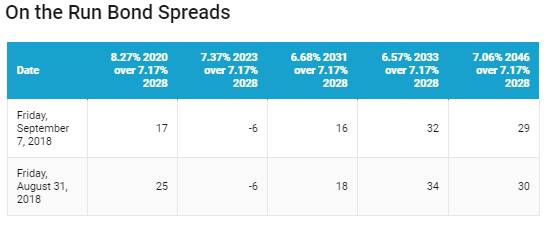
The 10-year benchmark government bond, the 7.17% 2028 bond, saw yields close 8 bps up at 8.03% on weekly basis. The benchmark 5-year bond, the 7.37% 2023 bond saw yields close 8 bps up at 8.09% and the 6.68% 2031 bond saw yields close 6 bps up at 8.19%. The long bond, the 7.06% 2046 bond, saw yields close 9 bps up at 8.32%.
OIS market saw one year yield close up by 10bps and five year OIS yield close up by 12 bps last week. One year OIS yield closed at 7.24% while five year OIS yield closed at 7.54%.
System liquidity as measured by bids for Repo, Reverse Repo, Term Repo and Term Reverse Repo in the LAF (Liquidity Adjustment Facility) auctions of the RBI and drawdown from Standing Facility (MSF or Marginal Standing Facility) and MSS/CMB bond issuance was in surplus of Rs 704 billion as of 7th September 2018. Liquidity was in surplus of Rs 236 billion as of 31stth August 2018.
Amount of Corporate Debt Downgrades down 33% year on year
In the April-July 2019 period, total amount of total corporate debt upgrades was Rs 557 billion, rising by 4.93% from Rs 530 billion in the same period last year. Total amount of corporate debt downgrades was down 33% to Rs 1199 billion,as per SEBI data. Amount of downgrades is 2.15 times more than upgrades,majorly concentrated around high levels of stressed assets in banking, commodity related sectors such as metals and mining and real estate sector.
· As on 7th September,FII debt utilisation status stood at 70.15% of total limits, 78 bps lower against the previous week. FII investment position was at Rs 4171 billion in INR debt. FII investment position stands at Rs 2131 billion in gilt securities that also includes investment in Interest Rate Futures and at Rs 2047 billion in corporate bonds.
· For the week ended 7th September,credit spreads rose. Three-year AAA corporate bonds were trading at levels of 8.80%, spreads were higher by 2 bps at 68 bps against previous week.
· Five-year AAA corporate bonds were trading at levels of 8.85%. Spreads were 7 bps higher at 60 bps.
· Ten-year AAA corporate bonds were trading at levels of 8.82% with spreads 7 bps lower at 63 bps.
· Three months and twelve months PSU bank CDs were trading at 7.10% and 8.10% levels at spreads of 29 bps and 63 bps respectively against T-bill yields.
· Three months’ maturity Manufacturing and NBFC sector CPs were trading at 7.20% and 7.67% levels respectively. One-year maturity Manufacturing and NBFC sector CPs were trading at 8.45% and 8.65% levels respectively.
Weekly G-sec Curve Spread Analysis
· G-sec yields rose to 4 year highs and breach the 8% mark as the INR fell to record lows.
· The yield curve flattened, as 10-year bond yields rose by 8 bps while long-end bond yields, the 6.68% 2031 & 7.06% 2046 bond yields, rose by 6-7 bps.
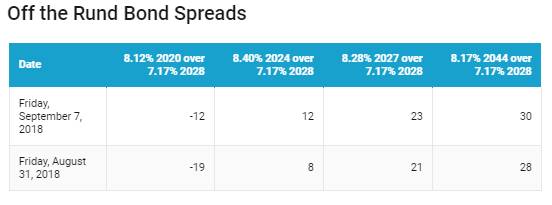
· Off the run bond spreads with the 10-year G-sec rose last week. (Table 2)
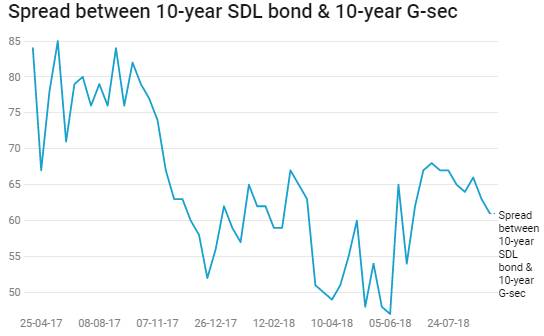
· On the 3rd September 2018 auction, the spread between SDLs with 10-year G-sec came at 61 bps. On 28th August 2018 auction, the spread between SDLs with 10-year G-sec was at 63 bps